Creating the best user experience calls for more than following best practices. You have to see what users are actually doing on your site to find out where the problems are.
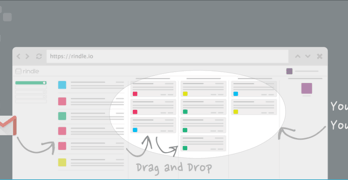
What if you could see what your users saw when they had trouble using your site? You would be able to refine and redesign your site to better meet their needs.
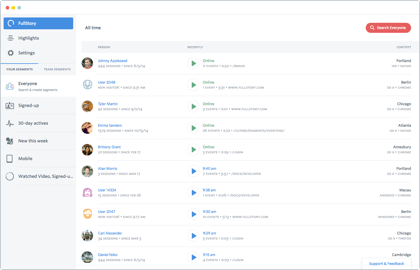
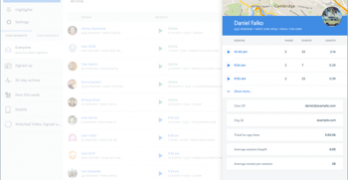
Google Analytics is one of the most popular analytics tools on the web. Ptengine is just like it, except it can track user engagement through heatmaps.
When you or I have a problem, it’s pretty easy for us to imagine a solution. And that solution is filtered through our experiences and responsibilities.
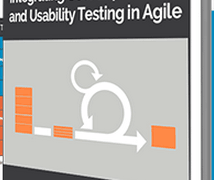
Designers don’t just like to design, sometimes they like to read. But there are many design articles on the web that go unread because of the lack of exposure.
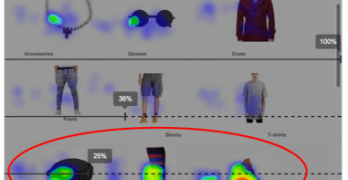
Imagine being able to see what area of your site users interact with the most. Wouldn't this make your job easier? That's what heatmaps allow designers to see.
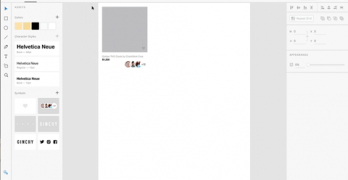
There comes a time when a designer is done wireframing and needs to focus on the style of their site. But without the right graphics, this is hard to do.
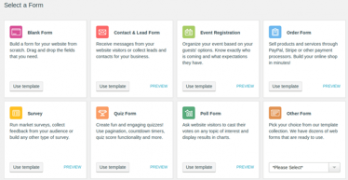
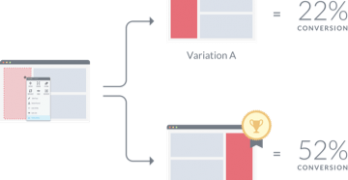
Everyone wants a perfect design that brings in the highest conversion rates. But how do you get there? The answer is A/B testing. A/B testing allows you to show different designs to your users.