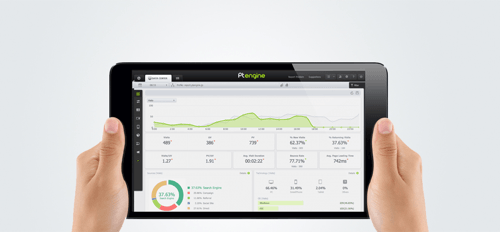
The more you know about your users, the better you can design for them. That’s why it’s important to use a quality heatmap and analytics tool to track user behavior and activity on your website.
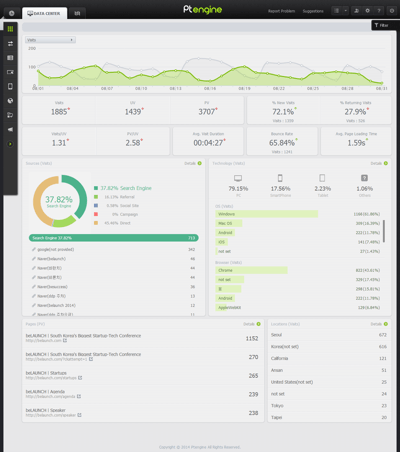
Ptengine isn’t your typical heatmap and analytics platform. Other analytics tools, such as Google analytics make you wait for the latest data. Ptengine gives you data in real-time as users use your website so that you can make adjustments on the fly.
Ptengine vs. Google Analytics
One thing that separates Ptengine from Google analytics is it’s easy-to-use user interface. Its user-friendly dashboard saves you time from analyzing the data. The data you see is so straightforward that anyone on your team can use it. And you don’t need to hire any data analysts to write reports and explain the results.
Google Analytics gives you quantitative metrics, but its limited in the data features it offers. Here’s a breakdown of Ptengine’s full-range of data features.
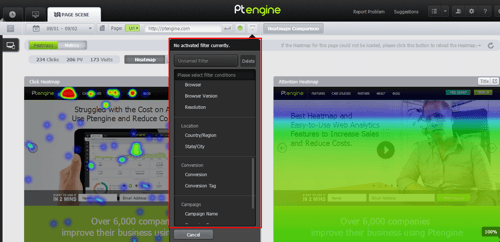
Segment Analysis – Filter unlimited segments with one click on the Ptengine dashboard. Filtering in Google Analytics is difficult and takes many clicks to get the results you want.
Time on Page Metrics – Ptengine accurately calculates time on page by detecting traffic every 30 seconds. Google Analytics does this by subtracting the time users go from one page to another without counting users who only visited one page.
Page Analysis – Ptengine shows the total number of clicks on a webpage, regardless if they’re interactive or non-interactive elements. Google Analytics only gives stats on the number of clicks from interactive elements, such as buttons and links.
Heatmaps Features – Heatmaps generated in Ptengine tell you exactly where users are clicking, and what content they’re focusing on. This tells you which areas of your website need improvement.
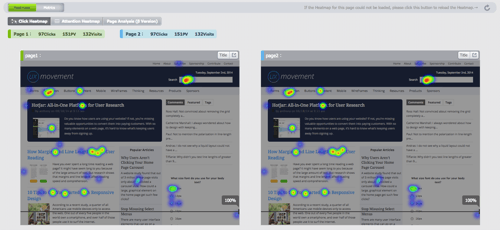
Click Heatmaps – See which area of your website is getting the most clicks. You can also compare clicks on different pages.
Attention Heatmaps – Ptengine gathers information based on user behavior, and shows you which areas get the most attention.
Scolling Heatmaps – Observe user scrolling behavior and see how far down the page they’re scrolling. Scrolling heatmaps are useful for optimizing the page fold.
Ptengine’s Heatmap Technology
Unlike other heatmap tools, Ptengine uses a unique dual locating technology. Not only can it locate click coordinates, but it also confirms the clicks via interactive elements code ID. This means Ptengine supports responsive design, and displays accurate heatmaps for any screen size.
Ptengine also allows you to filter unlimited segments across any of your categories.
You can also compare heatmaps of different pages to each other. This is not only perfect for A/B testing, but for comparing different advertising campaigns.
Try It for Free
Ptengine just launched and is offering free trials. Go to their website and sign up to see what their heatmaps and analytics technology can do for your website.
___
sponsored article


Looks good but I can’t find any pricing information whatsoever…
Hi Tad, you can find the pricing information in the Account Settings if you had already registered an account and setup a profile.